(2 months ago) · Ciprian Rarau · Building · 6 min read
AI-Powered Alert Summarizer: Claude Reads My Logs So I Don't Have To
How I built a serverless alert system that uses Claude to analyze error logs and post human-readable summaries to Slack. No Docker, no servers, under $1/month.

I have been paged at 2 AM more times than I can count, only to spend the first several minutes squinting at raw log lines trying to figure out what actually broke. That delay always frustrated me. It felt like the monitoring system was doing half its job, telling me something was wrong but leaving me to figure out the rest on my own. I wanted the alert itself to tell me what happened, so I could skip straight to fixing it.
The Problem
GCP Cloud Monitoring sends alerts like this:
“Alert: Backend API Errors - production exceeded threshold of 25 in 5 minutes”
That tells me something broke. It doesn’t tell me:
- Which endpoint is failing
- What the actual error is
- Whether it’s affecting one user or thousands
- What I should check first
I was spending the first 5 minutes of every incident reading logs to understand what the alert was actually about. That’s 5 minutes of MTTR wasted on context-gathering.
The Solution
Route alerts through an AI that reads the logs and tells me what’s happening.
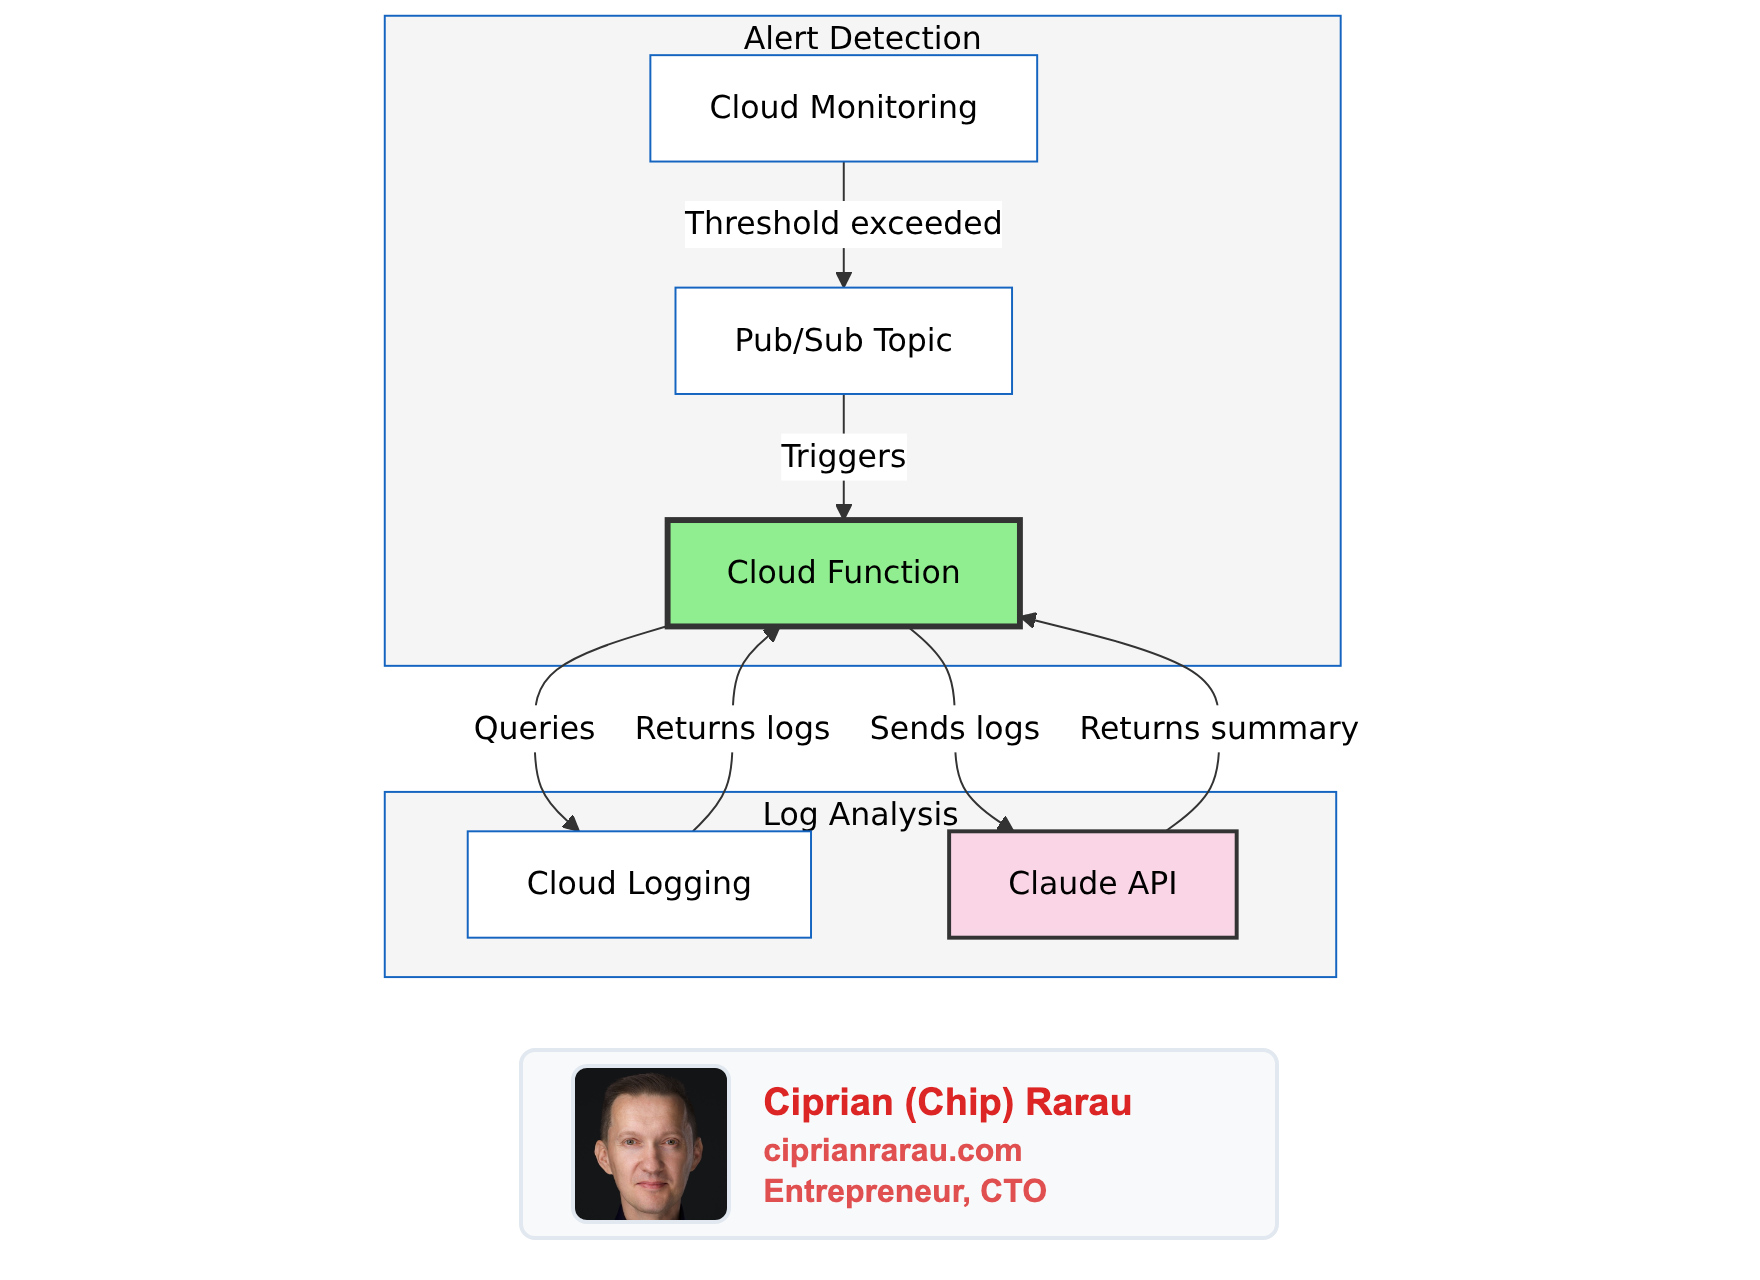
The Architecture
What Gets Created (Per Environment)
| Resource | Purpose |
|---|---|
| Pub/Sub Topic | Receives alert notifications |
| Cloud Function (2nd Gen) | Processes alerts, calls Claude |
| Service Account | Minimal permissions for log reading |
| Secret Manager (2 secrets) | Anthropic API key, Slack token |
| Notification Channel | Routes monitoring alerts to Pub/Sub |
Environment Parity
Same infrastructure across all three environments:
| Component | Development | Staging | Production |
|---|---|---|---|
| Error Threshold | 5 / 5min | 10 / 5min | 25 / 5min |
| Slack Channel | #alerts-backend-dev | #alerts-backend-staging | #alerts-backend-production |
| Function | alert-summarizer-dev | alert-summarizer-staging | alert-summarizer-prod |
The Cloud Function
The function is ~500 lines of Python. Here’s the core flow:
@functions_framework.cloud_event
def process_alert(cloud_event):
    """Entry point for Pub/Sub-triggered alerts."""
    # 1. Decode the alert from Pub/Sub
    alert_data = json.loads(
        base64.b64decode(cloud_event.data["message"]["data"])
    )
    incident = alert_data.get("incident", {})

    # 2. Skip if not actionable
    if incident.get("state") != "open":
        return "OK"  # Ignore resolved alerts

    alert_age = time.time() - incident.get("started_at", 0)
    if alert_age > 3600:
        return "OK"  # Skip stale alerts (logs may be gone)

    # 3. Fetch relevant logs from Cloud Logging
    logs = get_logs(
        policy_name=incident["policy_name"],
        start_time=incident["started_at"],
        project_id=incident["scoping_project_id"]
    )

    if not logs:
        return "OK"  # No logs = nothing to summarize

    # 4. Send to Claude for analysis
    summary = summarize_with_claude(logs, incident["policy_name"])

    # 5. Post to appropriate Slack channel
    channel = get_slack_channel(incident["policy_name"])
    post_to_slack(summary, incident, channel)

    return "OK"
Two Types of Prompts
The system handles application errors and infrastructure events differently:
Application Errors (Backend API, ML services):
prompt = """Analyze these error logs and provide a summary:
- What's failing (which endpoint, which operation)
- Error pattern (is it one error repeating or multiple issues)
- Likely root cause
- Recommended action

Be concise. Use Slack markdown. Bold the key findings."""
Infrastructure Events (IAM changes, Cloud SQL, secrets):
prompt = """Analyze this infrastructure audit event:
- What happened (the operation)
- Who did it (the actor)
- What resource was affected
- Risk assessment (is this expected or suspicious)
- Action needed (if any)

Be concise. Use Slack markdown. This goes to ops."""
Same Claude model, different perspectives for different audiences.
Intelligent Routing
The function routes to different Slack channels based on alert type:
def get_slack_channel(policy_name: str) -> str:
    """Route alerts to appropriate channels."""
    policy_lower = policy_name.lower()

    if "backend" in policy_lower:
        return f"alerts-backend-{environment}"
    elif "ml" in policy_lower:
        return f"alerts-ml-{environment}"
    else:
        return f"alerts-infrastructure-{environment}"
Backend developers get backend errors. Infrastructure team gets IAM changes. Nobody gets everything.
Noise Filtering
Not every error deserves an alert. I filter at the log metric level:
BACKEND_EXCLUSIONS = [
    "TerraServiceContext",          # Third-party webhook noise
    "Invalid Firebase OOB code",    # User fat-fingered their email
    "FirebaseAuthMethodNotFound",   # Expected during logout
    "Rate limit exceeded",          # Firebase rate limiting
    "/api/v2/terra/",              # Terra webhook calls
]
These patterns are excluded from the log-based metric itself, so they never trigger alerts in the first place. No wasted Pub/Sub messages, no wasted Claude API calls.
The Slack Message
The function posts rich Slack blocks:
blocks = [
    {
        "type": "header",
        "text": {
            "type": "plain_text",
            "text": f"🚨 {policy_name}",
            "emoji": True
        }
    },
    {
        "type": "context",
        "elements": [{
            "type": "mrkdwn",
            "text": f"Started: <!date^{start_time}^{{date_short}} {{time}}|{start_time}>"
        }]
    },
    {
        "type": "section",
        "text": {
            "type": "mrkdwn",
            "text": summary  # Claude's analysis
        }
    },
    {
        "type": "actions",
        "elements": [{
            "type": "button",
            "text": {"type": "plain_text", "text": "View Logs"},
            "url": logs_url,  # Pre-filtered Cloud Logging link
            "action_id": "view_logs"
        }]
    }
]
The “View Logs” button opens Cloud Logging with:
- Exact time window (10 minutes from alert start)
- Pre-filled filter for the service
- Correct GCP project
One click to the relevant logs. No manual filtering.
Terraform Module
Everything is infrastructure-as-code:
module "alert_summarizer" {
  source = "./modules/global/alert-summarizer/"

  project_id        = var.gcp_project_id
  environment       = var.environment
  region            = var.gcp_region
  enabled           = var.alert_summarizer_enabled
  anthropic_api_key = var.anthropic_api_key
  slack_auth_token  = var.slack_auth_token
}

module "global_monitoring" {
  source = "./modules/global/monitoring/"

  # Connect monitoring to the summarizer
  alert_summarizer_channel_id = module.alert_summarizer.notification_channel_id
}
Deploy to a new environment:
terraform apply -var-file=development.tfvars
terraform apply -var-file=staging.tfvars
terraform apply -var-file=production.tfvars
Same module, three environments, identical behavior.
Testing
Simulate an Alert
gcloud pubsub topics publish alert-summarizer-development \
  --project=my-project-dev \
  --message='{
    "incident": {
      "policy_name": "Backend API Errors - development",
      "condition_name": "Backend errors exceed threshold",
      "started_at": 1704902043,
      "state": "open",
      "scoping_project_id": "my-project-dev"
    }
  }'
Write Test Logs
gcloud logging write api-service-test-errors \
  '{"message": "Test database connection error", "endpoint": "/api/users"}' \
  --project=my-project-dev \
  --payload-type=json \
  --severity=ERROR
Check Function Logs
gcloud functions logs read alert-summarizer-development \
  --project=my-project-dev \
  --region=us-east1 \
  --limit=20
Cost Analysis
| Component | Monthly Cost |
|---|---|
| Cloud Functions | ~$0.40 (10 invocations/day × 2s) |
| Claude API | ~$0.30 (10 summaries/day × 200 tokens) |
| Pub/Sub | <$0.01 |
| Secret Manager | ~$0.12 (2 secrets) |
| Total | ~$0.83/month |
Under a dollar a month. Scales linearly if alert volume increases.
Why This Works
Serverless, Not Docker
No containers to build, push, or manage. The function is just Python code zipped and uploaded. GCP handles the runtime.
resource "google_cloudfunctions2_function" "alert_summarizer" {
  name    = "alert-summarizer-${var.environment}"

  build_config {
    runtime     = "python312"
    entry_point = "process_alert"
    source {
      storage_source {
        bucket = google_storage_bucket.function_source.name
        object = google_storage_bucket_object.function_zip.name
      }
    }
  }

  service_config {
    max_instance_count = 10
    min_instance_count = 0  # Scale to zero
    available_memory   = "512Mi"
    timeout_seconds    = 120
  }
}
Security by Default
- Function has
ALLOW_INTERNAL_ONLYingress - Service account has minimal permissions (logging.viewer + specific secrets)
- API keys stored in Secret Manager, not environment variables
- Pub/Sub topic accessible only to Cloud Monitoring
Graceful Degradation
- Stale alerts (>1 hour) are skipped
- Closed incidents are ignored
- No logs found = no empty Slack posts
- Errors are logged but don’t crash the function (returns 200 OK)
The Philosophy
Alerts should tell you what’s wrong, not just that something is wrong.
Raw monitoring alerts are designed for machines - thresholds exceeded, conditions met, metrics breached. But humans respond to alerts. Humans need context.
AI bridges that gap. It reads the machine-generated logs and translates them into human-actionable summaries. The 5 minutes I used to spend reading logs now happens before the Slack message arrives.
That’s 5 minutes of MTTR saved per incident. For an infrastructure that might have 10 incidents per month across all environments, that’s almost an hour saved. For under a dollar.